Contents
- Index
Spectrogram View
When you recall a previous rehearsal with Load Take, or immediately after a rehearsal has been successfully completed, M+O will display your audio as a grey-level image known as a "spectrogram" in the center of the Main Window. The spectrogram provides a way of visualizing audio.
The horizontal axis of the spectrogram corresponds to time, while the vertical axis corresponds to frequency or pitch. Thus the spectrogram shows frequency content changing over time. A bright point in the spectrogram means there is a lot of sound energy at the time (distance from left ) and frequency (distance from bottom) corresponding to the point. During a single musical note the spectrogram shows a collection of evenly spaced parallel horizontal lines corresponding to the various "harmonics" or "overtones" of the sound. In a single note these harmonics are relatively constant in frequency which is why we see horizontal lines. Higher notes have a higher placement of the lowest or "fundamental" frequency, as well as having wider spacing between harmonics. As the pitch changes within a note, for instance with vibrato, these lines will "wiggle" reflecting the microtonal variation in pitch. Note changes are easily identified in the spectrogram as places where both the harmonic heights and the spacing between harmonics changes.
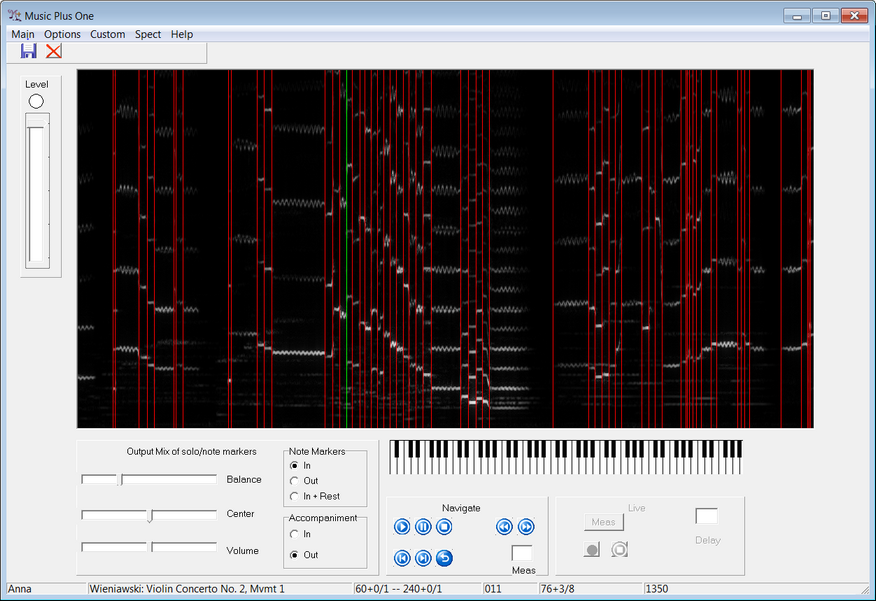
Below is a section of music audio depicted with M+O's spectrogram representation. The vertical lines mark the note onsets identified by M+O, marked by clicks or plucks in the audio playback.